Weakness Test#
The Weakness Test panel allows users to analyze model weaknesses by segmenting data and evaluating performance using different slicing methods. This panel provides insight into potential performance, overfitting, reliability, and robustness issues.
Initialize the Panel#
To create and initialize the Weakness Test panel, use:
# Load the Experiment and view model weaknesses
from modeva import Experiment
exp = Experiment(name='Demo-SimuCredit')
exp.test_weakness()
Workflow#
Step 1: Select Dataset & Models#
Select a Dataset: The dataset from the dropdown for processing is automatically selected based on the processed dataset of the experiment (e.g.,
Demo-SimuCredit_md).Select a Data Selection: Choose a data split (e.g.,
test).Set Select Target Model: Pick a registered model from the dropdown (e.g.,
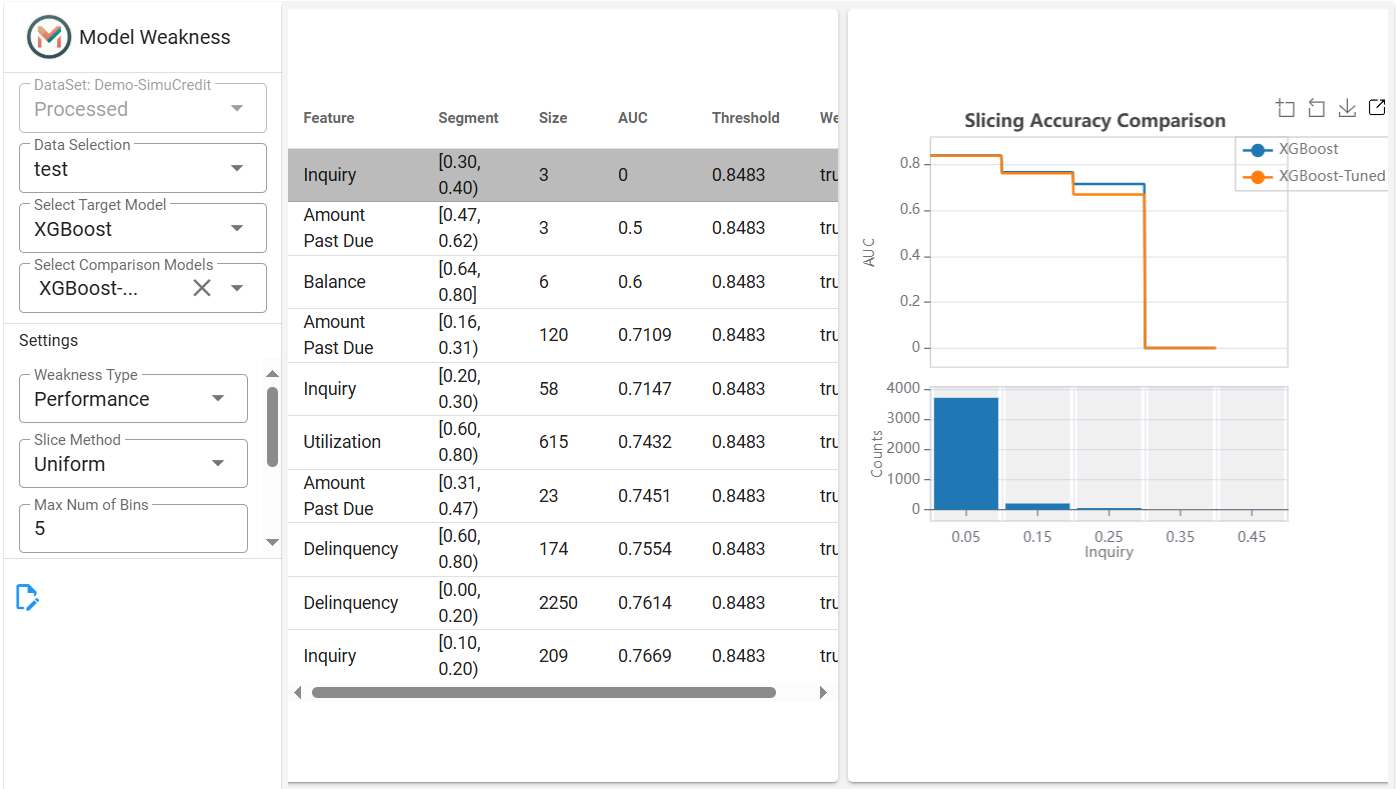
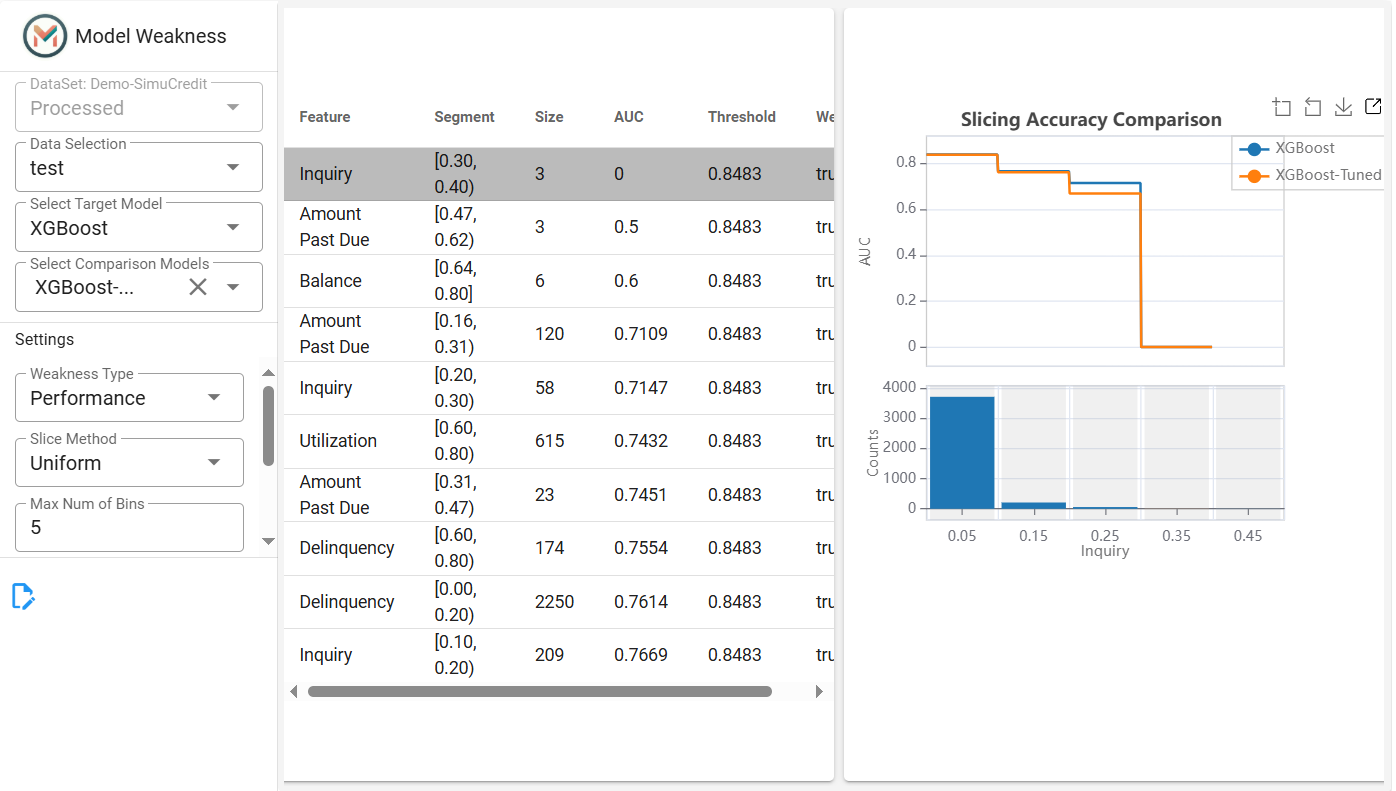
XGBoost).(Optional) Set Select Comparison Models: Pick additional models for comparison.
The comparison models are displayed in the slicing plot for comparison if selected.
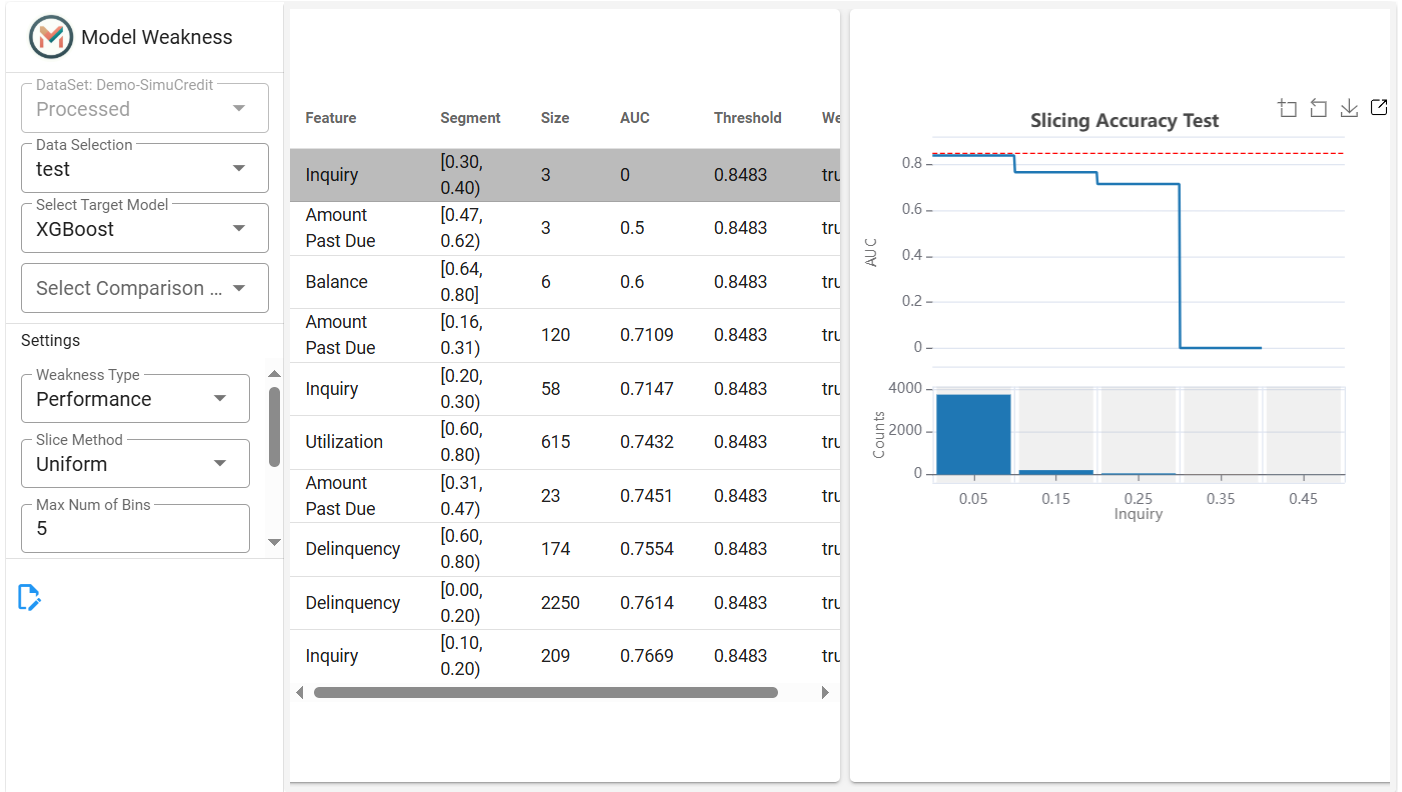
Step 2: Detect Weak Features and Segments#
Select Weakness Type:
Performance: Evaluate model performance. The related performance metric (e.g., AUC) will be displayed in the leaderboard and slicing plot.
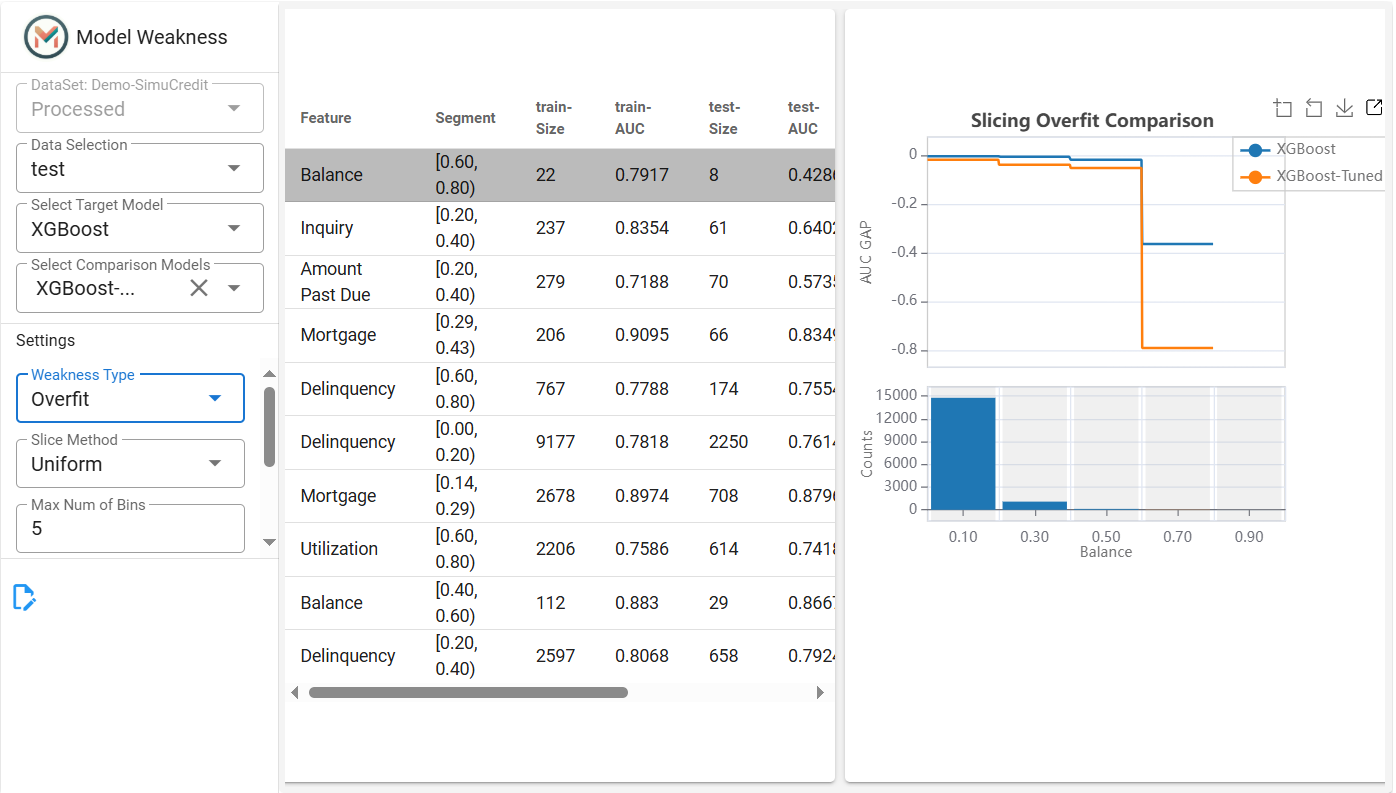
Overfit: Detect overfitting issues. Train, test performance, and performance gap will be displayed in the leaderboard and slicing plot.
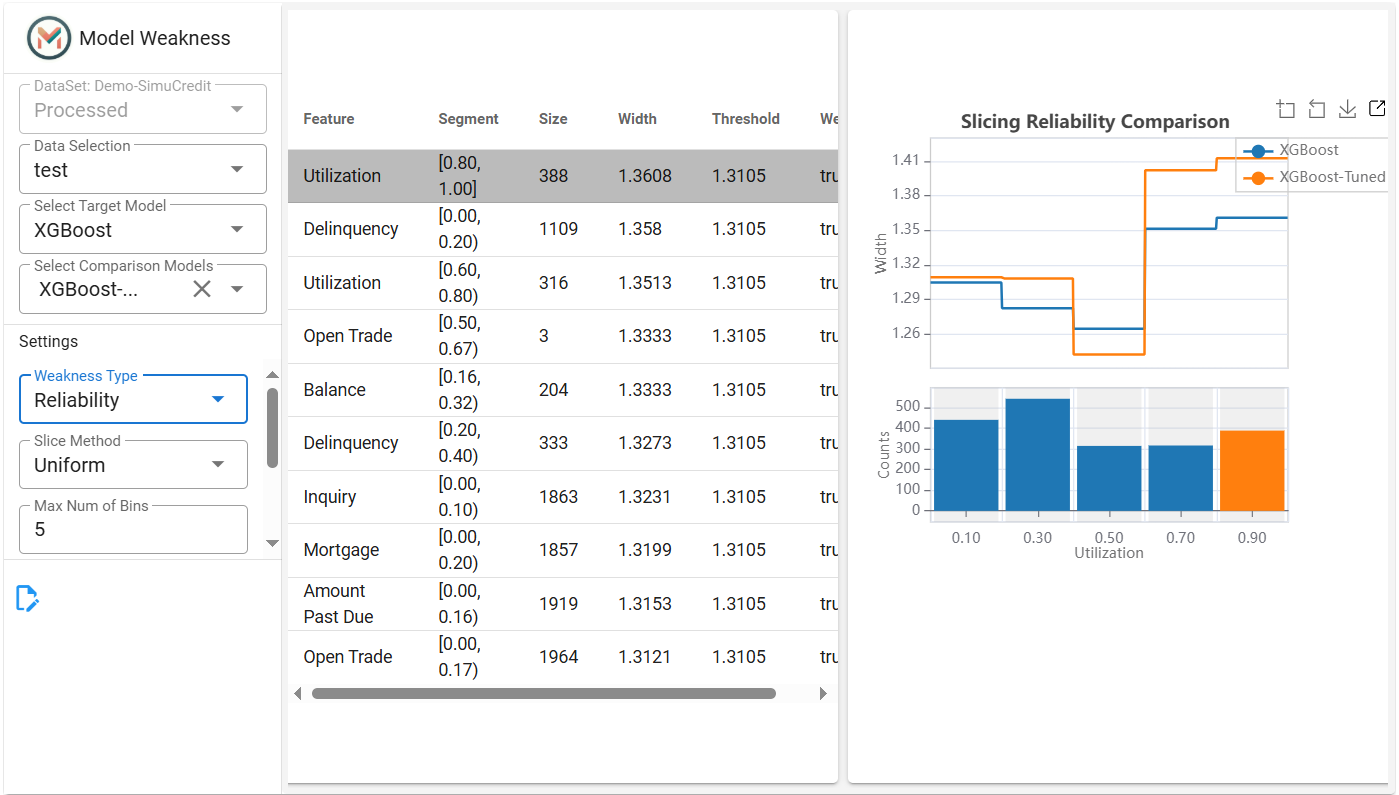
Reliability: Assess model reliability. The reliability metric (e.g., prediction interval) will be displayed in the leaderboard and slicing plot.
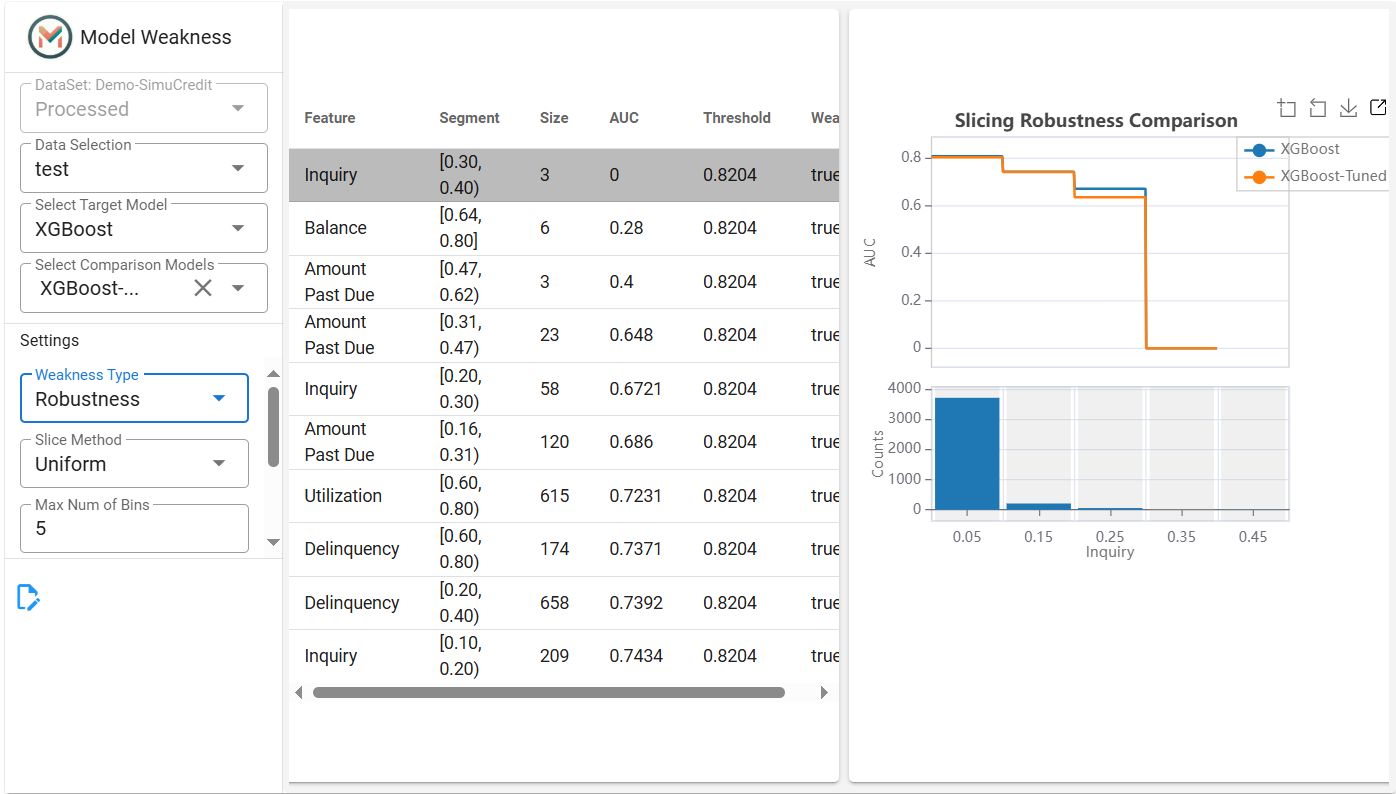
Robustness: Evaluate model robustness. The related metric (e.g., AUC) after perturbation will be displayed in the leaderboard and slicing plot.
Select Slice Method: Slicing method for data segmentation. Options include:
Uniform: Slices data uniformly.
Quantile: Slices data based on quantiles.
Auto-XGB1: Slices data using bins of an XGBoost depth-1 model fitted between X and residuals.
Set Max Num of Bins: Bins for slicing data, default 5.
Set Metric: Performance metric for evaluation, options include: AUC, ACC, etc. for classification tasks, and MSE, MAE, etc. for regression tasks.
Set Random State: Default 0.
Click a row in the leaderboard to view the marginal analysis plot for the selected feature.
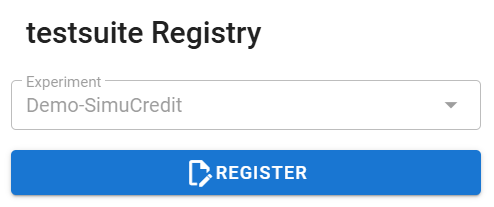
Step 3: Saving Results#
Click the
 button to save test results.
The Weakness Test panel is a powerful tool for analyzing model performance across different data segments. It provides interactive exploration of model weaknesses, supporting informed decision-making in model improvement. For more information, refer to the Weakness Detection.