EDA Multivariate#
The EDA Multivariate panel enables users to perform exploratory data analysis (EDA) on multiple features simultaneously. It provides correlation analysis, PCA (Principal Component Analysis), and UMAP (Uniform Manifold Approximation and Projection) for dimensionality reduction and pattern discovery.
Initialize the Panel#
To create and initialize the EDA Multivariate panel, use:
# Load the Experiment and view the multivariate analysis
from modeva import Experiment
exp = Experiment(name='Demo-SimuCredit')
exp.eda_multivariate()
Workflow#
Step 1: Load and Select Dataset#
Select a dataset from the Dataset Selection dropdown.
Choose a data split (e.g.,
main,train,test) to analyze specific subsets.
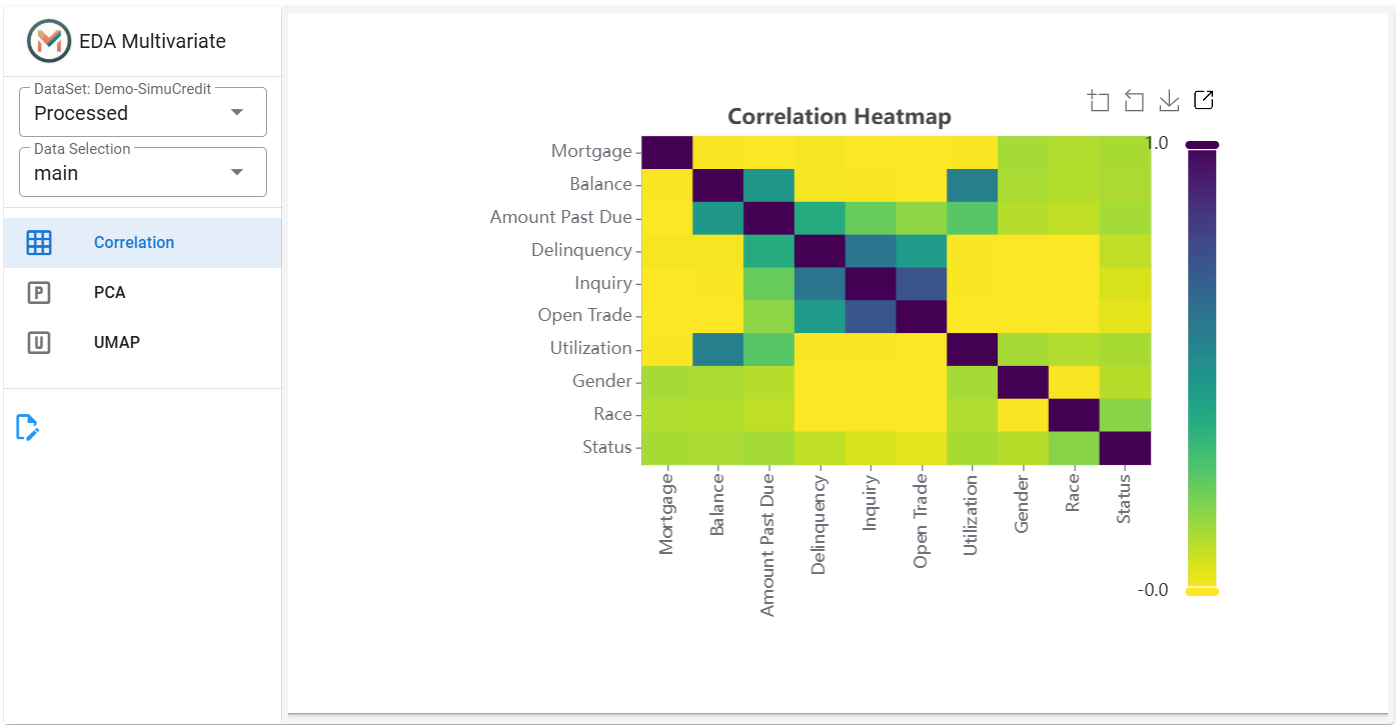
Step 2: Perform Correlation Analysis#
Click the Correlation tab.
Displays a correlation heatmap to detect relationships between numerical variables for feature selection or dimensionality reduction.
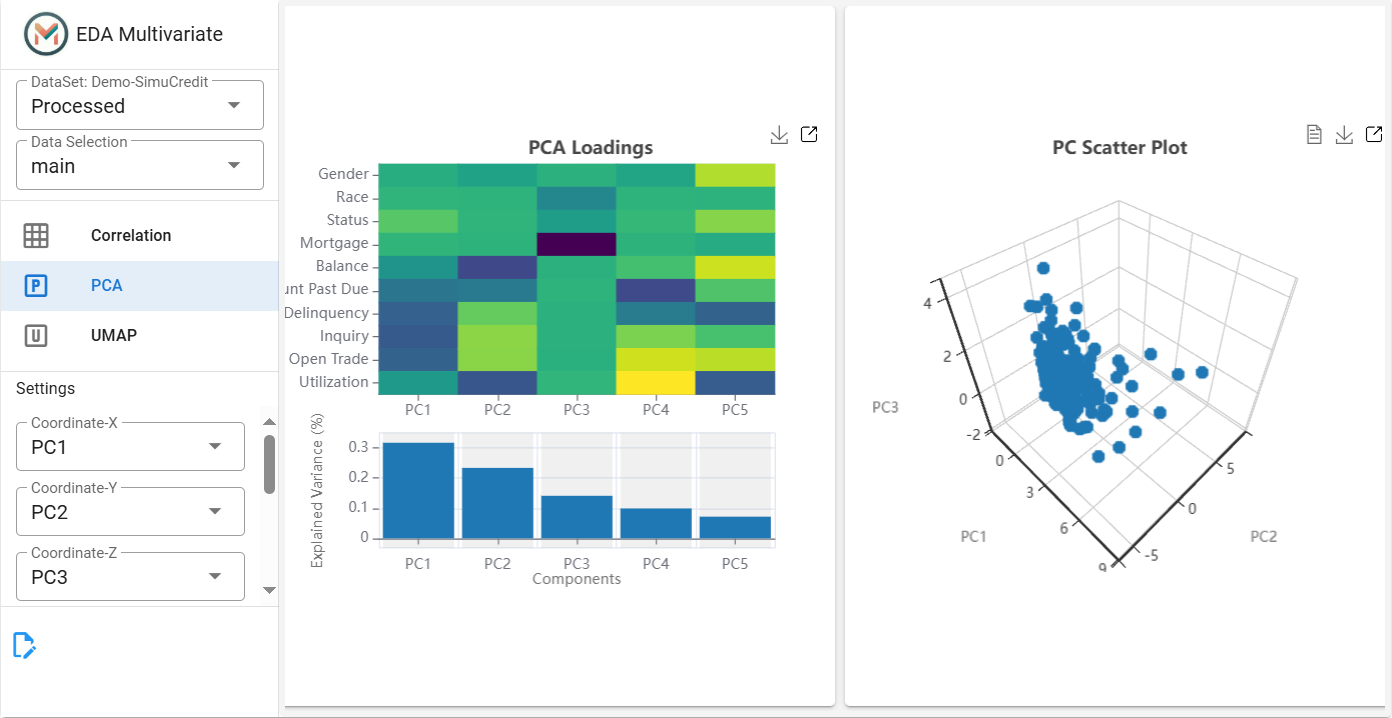
Step 3: Apply Principal Component Analysis (PCA)#
This tab displays the PCA loading plot and 3D scatter of principal components for visualization. PCA helps reduce the dimensionality of the dataset while preserving the most important information. This step is useful for identifying clusters and patterns in the data.
Click the PCA tab.
Set Number of Components (``n_components``) (default = 5) and select X, Y, and Z coordinates from the principal components (e.g.,
PC1,PC2,PC3).
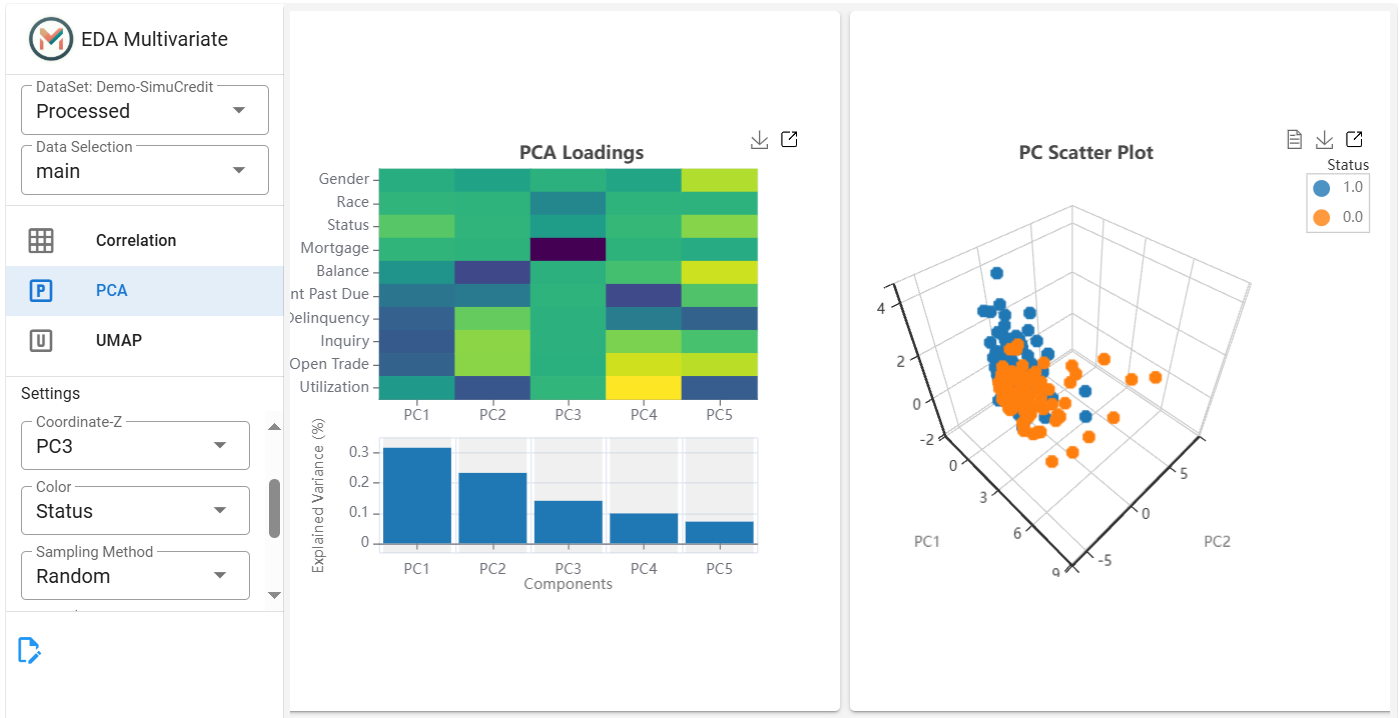
(Optional) Add a color feature for subgroup highlighting.
(Optional) Adjust Sampling Method and Sampling Proportion for performance optimization.
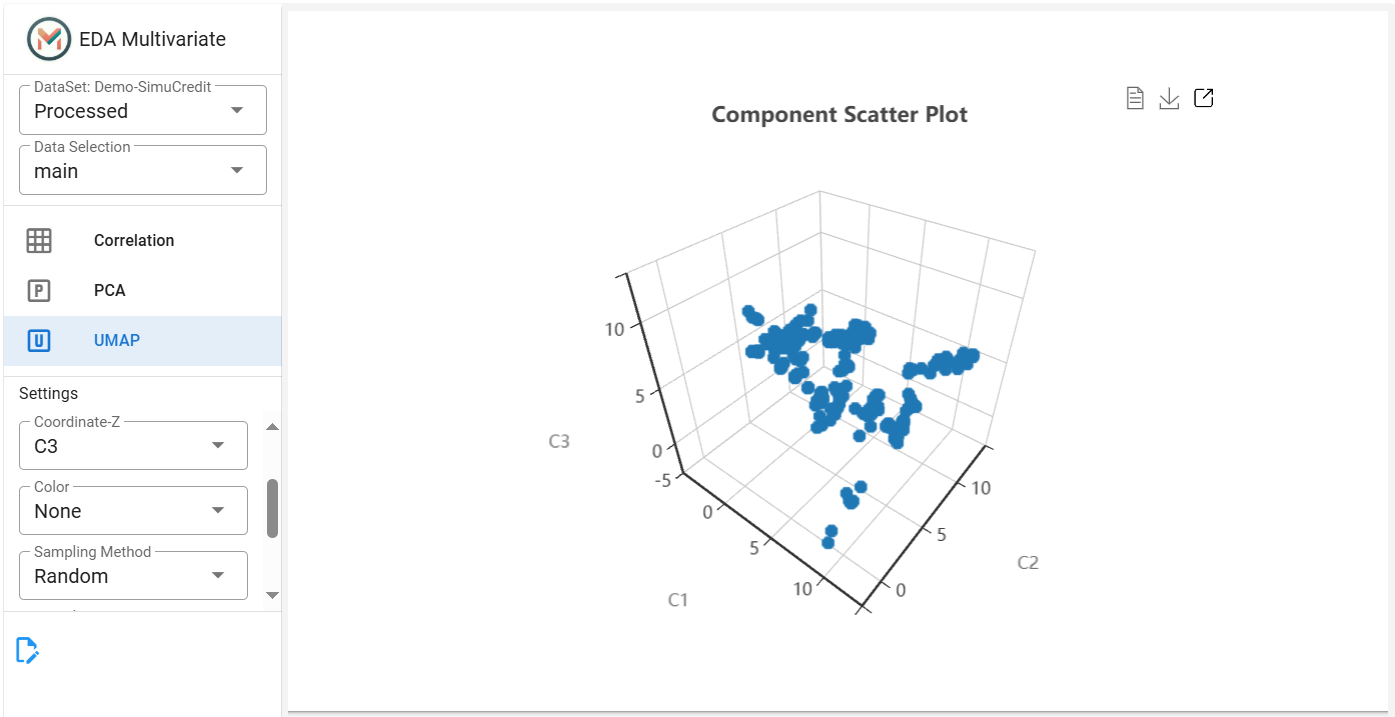
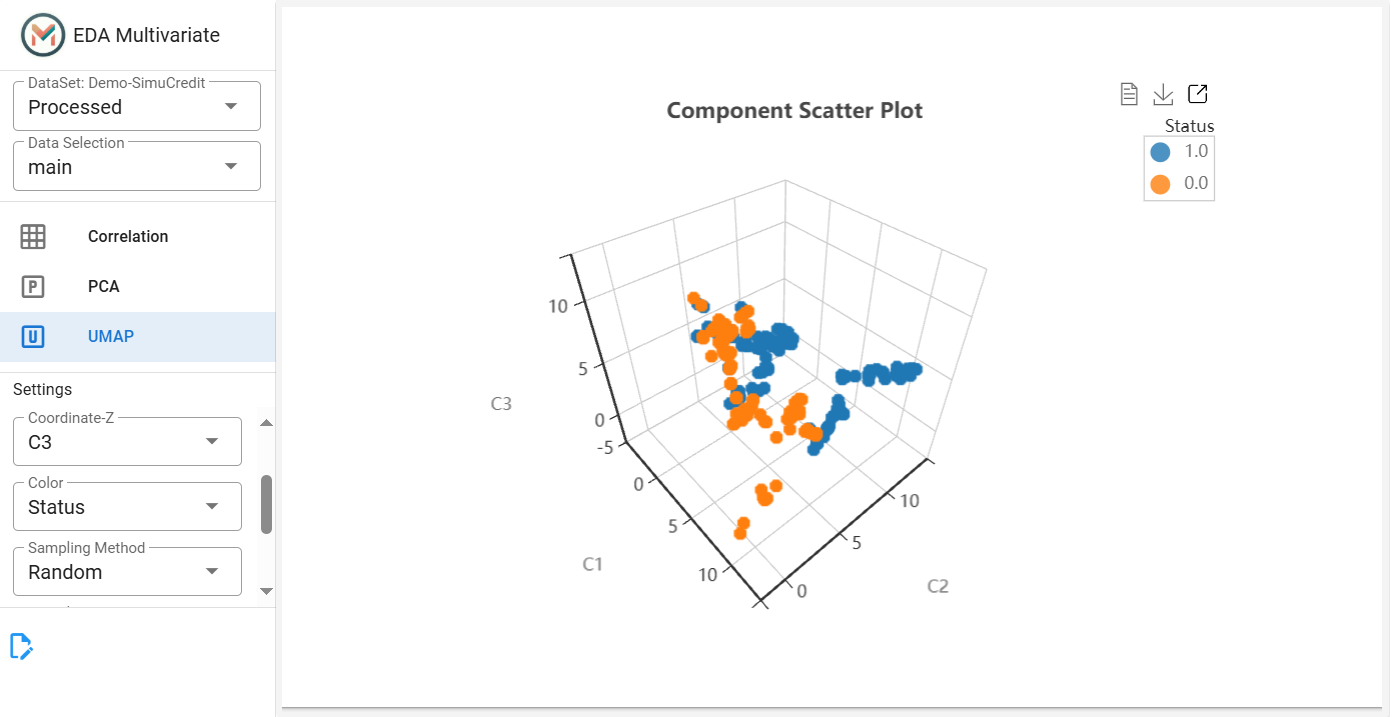
Step 4: Apply UMAP for Advanced Visualization#
This tab displays the UMAP scatter plot for advanced visualization of complex data structures. UMAP is a nonlinear dimensionality reduction technique that helps visualize complex patterns in the dataset.
Click the UMAP tab.
Set Number of Components (``n_components``) (default = 5), adjust Number of Neighbors (``n_neighbors``) for clustering sensitivity and select X, Y, and Z coordinates (e.g.,
C1,C2,C3).
(Optional) Add a color feature to highlight subgroups.
(Optional) Adjust Sampling Method and Proportion if necessary.
Step 5: Save and Export Results#
Click the
 to save plots for future reference.
Troubleshooting#
Slow Rendering: Too many data points. Reduce the sampling proportion.
UMAP Takes Too Long: High
n_neighborsor large dataset. Reduce the number of neighbors or apply sampling.
The EDA Multivariate panel streamlines multivariate analysis with interactive visualizations, making it easier to detect patterns, relationships, and clusters within your dataset. For more information, refer to the Exploratory Data Analysis.