Model Comparison#
The Model Comparison panel enables the evaluation of multiple registered models across four key dimensions: Performance, Reliability, Robustness, and Resilience.
Initialize the Panel#
To create and initialize the Model Comparison panel, use:
# Load the Experiment and compare models
from modeva import Experiment
exp = Experiment(name='Demo-SimuCredit')
exp.model_compare()
Workflow#
Step 1: Select Dataset & Models#
Select a Dataset: The dataset from the dropdown for processing is automatically selected based on the processed dataset of the experiment (e.g.,
Demo-SimuCredit_md).Set the Data Selection: Choose a data split (e.g.,
test).Set Select Model: Pick multiple registered models from the dropdown (e.g.,
XGBoost,XGBoost-tune).
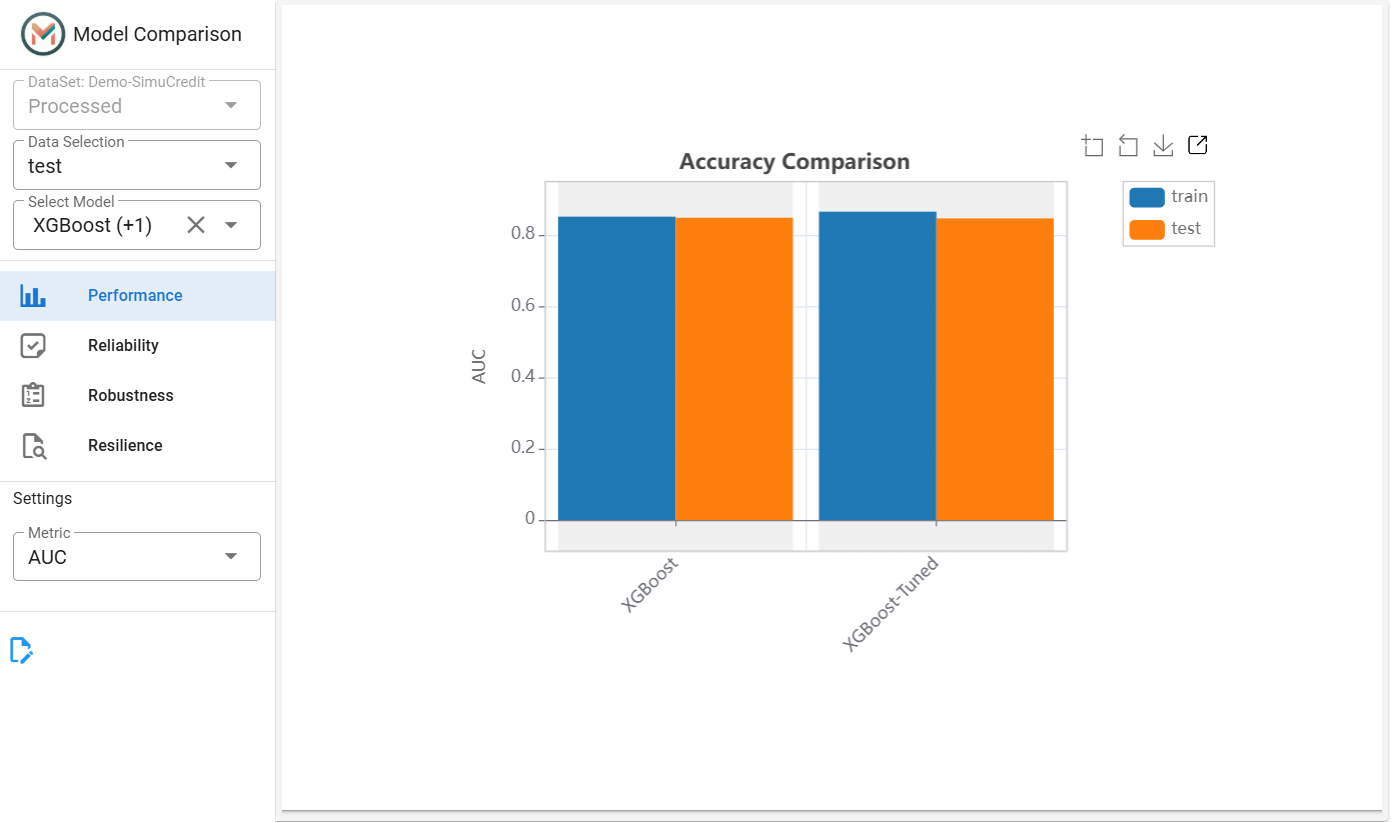
Step 2: Performance Comparison#
Select Performance Metric: Choose a task-specific metric (e.g., MSE for regression, AUC for classification).
View Outputs:
Bar Chart: Visualizes metric values for direct comparison.
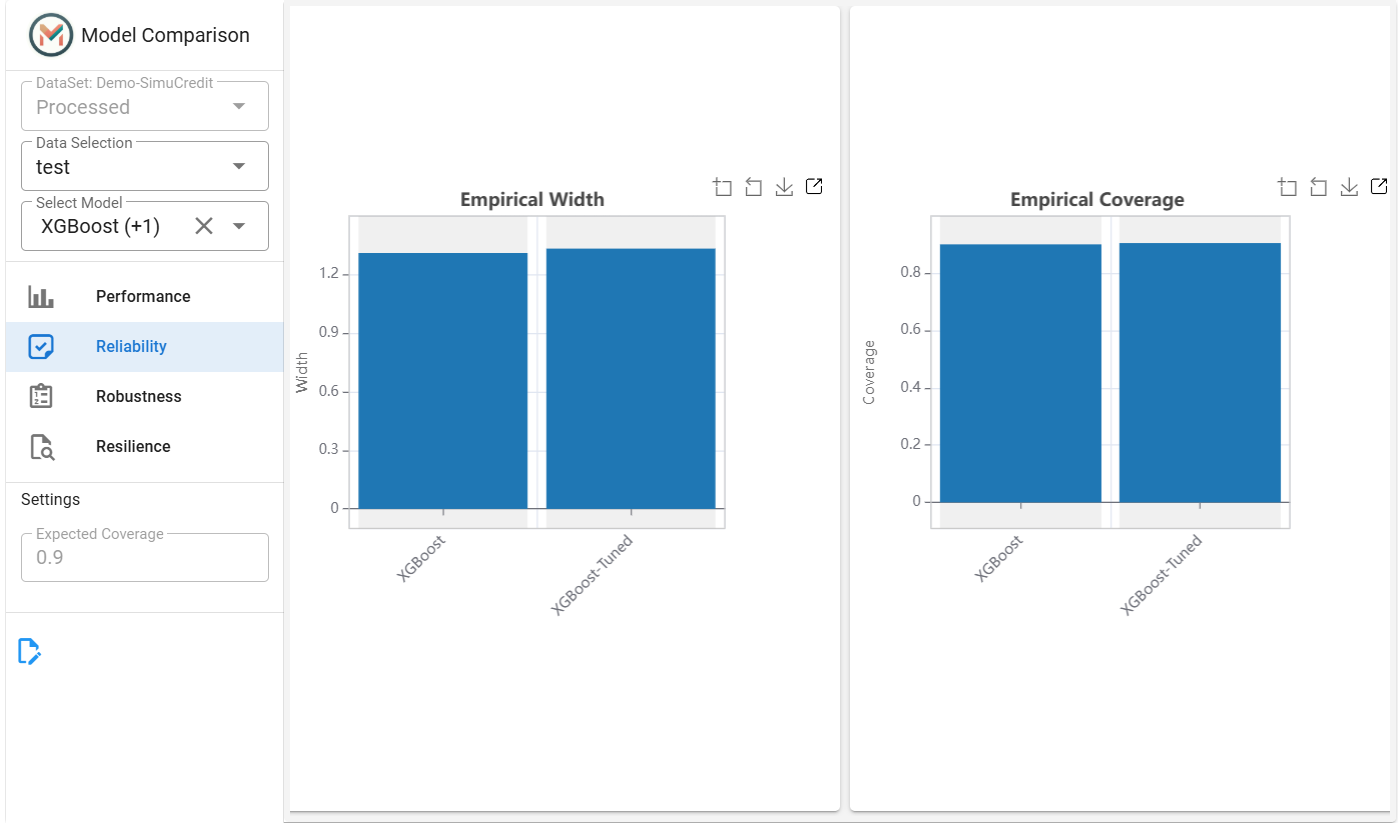
Step 3: Reliability Comparison#
Set Expected Coverage: Set confidence interval coverage (only for regression tasks - e.g., 0.9 for 90% coverage).
View Outputs:
Coverage Plot: Shows how well-predicted confidence intervals match actual outcomes.
Interval Width Plot: Compares confidence interval stability across models.
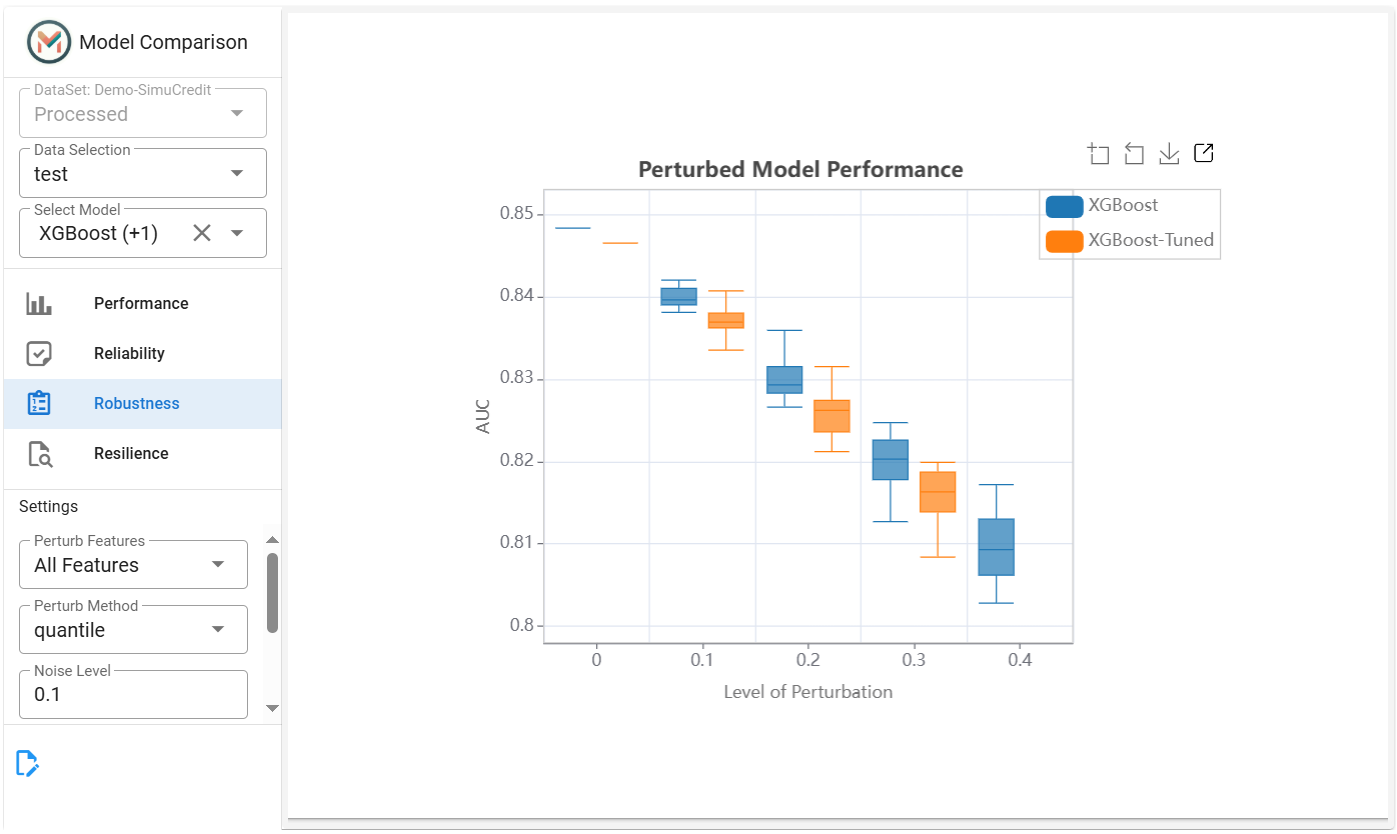
Step 4: Robustness Comparison#
Configure Perturbations:
Features: Select features to perturb (e.g.,
Mortgage).Method: Choose
quantile(distribution-based) ornormal(Gaussian noise).Noise Level: Set perturbation strength (e.g.,
0.1).Metric: Choose a task-specific metric (e.g.,
AUCfor classification).Random State: Set a seed for reproducibility.
View Outputs:
Robustness Curve: Shows how model performance degrades as noise increases.
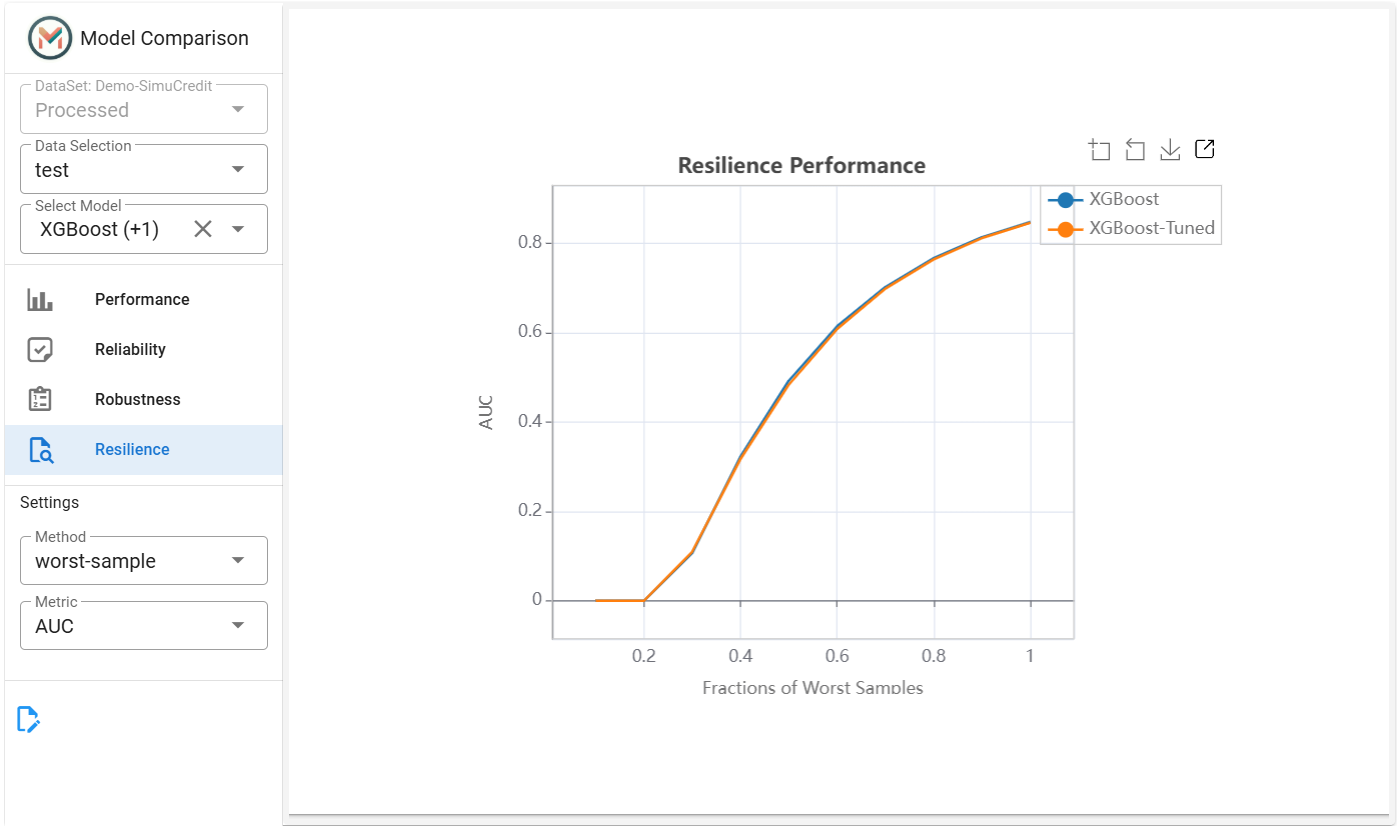
Step 5: Resilience Comparison#
Configure Resilience Settings:
Method: Select
worst-sample(identify high-error samples),worst-cluster(high-error cluster),outer-sample(boundary samples), orhard-sample(hard samples).Metric: Choose a task-specific metric (e.g.,
AUCfor classification).
View Outputs:
Resilience Plot: Highlights model performance as challenging sample sizes change.
Step 6: Saving Results#
Click the
 button to save test results.
This panel tests the performance, reliability, robustness, and resilience of multiple models to help you select the best model for deployment. Combine it with the Model Weakness panel for comprehensive model evaluation. For more information, refer to the Diagnostic Suite.